Five Simple Price Action Chart Analysis Tips- Forex Beginners
Five Simple Price Action Chart Analysis Tips- Forex Beginners

Forex trading may be confusing to novices. There are candles, trendlines, and indicators on the charts, and it is challenging to know when to get in or out of a trade. The thing is that you do not need complex tools to be able to trade effectively. Price action trading deals with the analysis of bare price movements, which gives you a better picture of the market. The article describes 5 simple price action chart analysis tips every forex beginner should understand to understand how to read markets, detect trends, and make smarter trades.
Understanding the Challenge: Why Beginners Do Not Fare Well
Most novice traders use numerous indicators, believing that the more indicators, the better. This usually causes confusion, late entries, and emotional trading. Novices fail to see important market turns as they are bombarded with data. This is made easier by price action, which centers on price movement indicating market sentiment and momentum. Some of the pain points are a lack of understanding of the direction of the trend, an inability to identify reversals, and responding emotionally to the market fluctuations. Such challenges may result in minimal losses accumulated with time or even total account drawdowns. Direct learning of how to read price movements can enable beginners to trade with confidence and clarity.
What Is Price Action Trading?
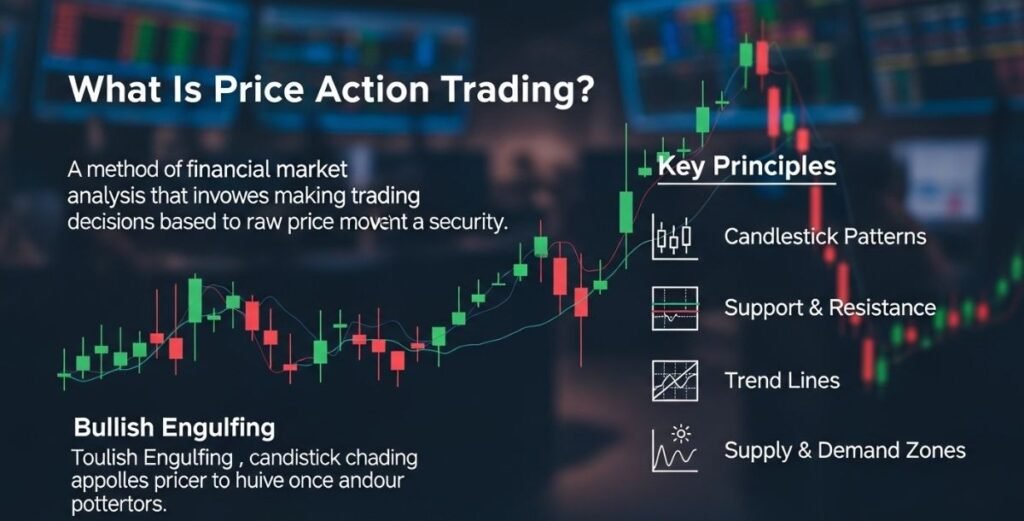
Price action trading refers to a style of trading that analyses the action of prices in the past, present, and future using charts and candlesticks rather than using lagging indicators. Traders seek patterns, key support and resistance zones, and trendlines to interpret the behavior of the market. Clear visual interpretation of trends, better entry and exit times, and time flexibility are the advantages of the price action for beginners. It gives a platform to more sophisticated trading plans and also enables traders to respond to the market instantly instead of responding to slow signals.
Five easy tips to price action chart analysis as a beginner
Start with Market Structure. The initial step that would be taken in price action analysis is to understand the market structure. Identify the markets as either in an uptrend, a downtrend, or sideways. Uptrend becomes characterized by higher highs and higher lows, whereas the downtrend has lower highs and lower lows. Lateral movement denotes the consolidation, in which the pressure to buy and sell is equal. The easiest method is to study larger periods like the H4 or Daily chart so that we can see the overall direction of the market.
Essentials of Candlestick Charting
Candlestick charts give an idea about the mood in the market. Simple and trusted patterns like pin bars, engulfing candles, and dojis should first be considered by newcomers. Such trends demonstrate where purchasers or vendors are experiencing an upward trend and are indicators of what might occur and what may not. An engulfing bullish at the support level, for instance, is a good indication of a good buying opportunity.
Target Support and Resistance Zones
Support and resistance zones are zones on which the price has been responsive. The buying pressure is where the decline is likely to be stopped, and the resistanceis where an advance is likely to be stopped. Novices ought to represent areas rather than straight lines since price hardly responds to a specific point. Looking at these zones and different timeframes enables one to determine the probability of price stalling or turning around.
Price Action + Trend Confirmation
The best use of price action is with trend confirmation. Compared to counter-trend trading, trading in the direction of the main trend is generally safer in the form of trading pullbacks. The first step is to determine the trend on the larger time periods and then observe the pullbacks and reversal patterns on the smaller time periods.
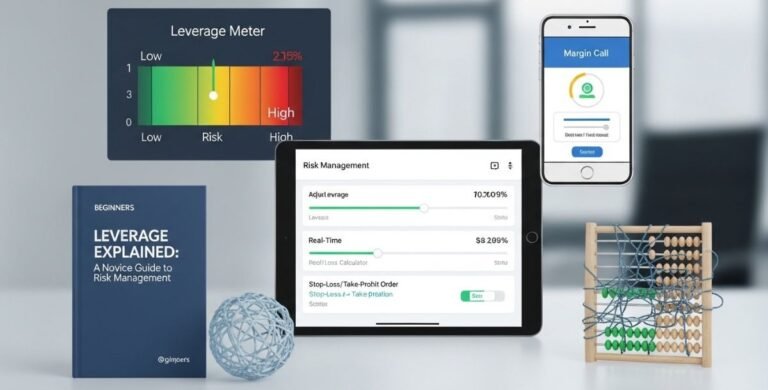
Risk Management Practice on the Topic of Price Levels
The best price action signals may go dead, and risk management becomes indispensable. The stop losses cannot be at the support or resistance area, but outside the area to avoid being stopped too early. Novices cannot afford to risk much of their account in any single trade; that is, it is usually 1-2 percent.
Common Mistakes to Avoid
The most common mistake made by beginners is to have too many indicators on the chart, which complicates the process of paying attention to the price movements. Other traders go against the market flow without paying attention to the market structure. Another typical error is emotional trading, which is usually brought about by impatience or fear. The inability to place proper stop-loss and overlooking longer periods may cause unnecessary losses.
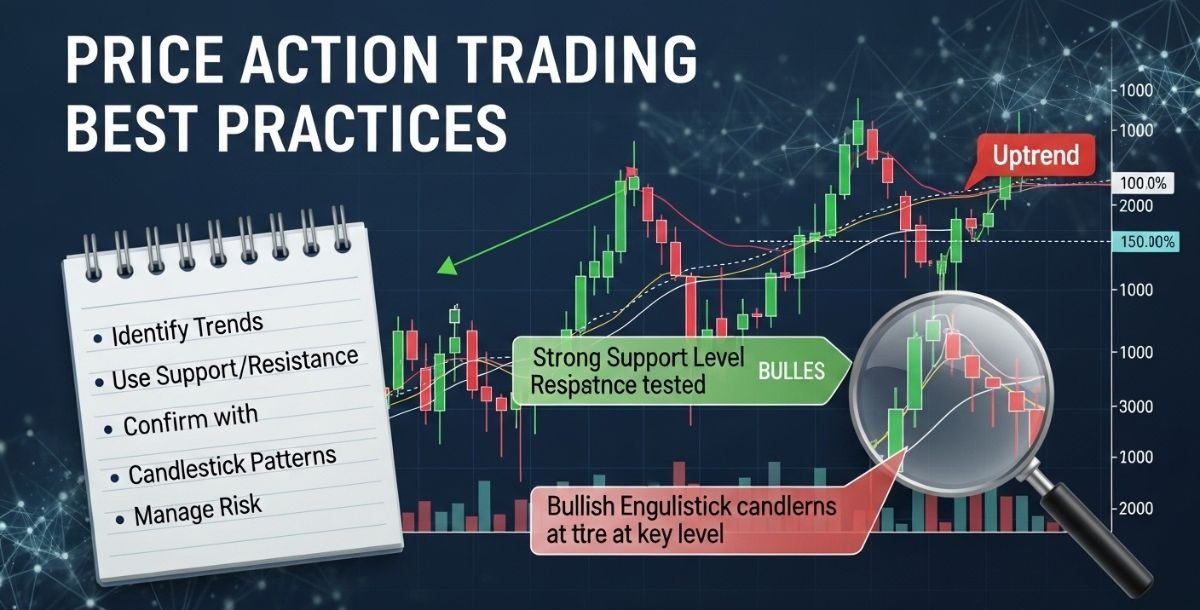
Price Action Trading Best Practices

Be consistent with the charts, making them simple and oriented to price, candlestick patterns, and key areas. The most common currency pairs, such as EUR/USD or GBP/USD, are a good place to start to simplify volatility issues. Trend analysis timeframes are higher,r and entry timing timeframes are lower. Having a trading journal allows one to follow patterns, setups, and performance. Largely, the most important thing is to practice with a demo account to save on real money. Regularity and order are much more valuable than pursuing complicated tactics.
FAQs
Which price action pattern should beginners find the easiest to follow?
The easiest and most valid patterns are pin bars and engulfing candles.
Should price action trading have indicators?
No. Price action is concerned with the pure price action, although indicators may be used as supplemental to your analysis.
What is the ideal time frame as an entrant?
Trend analysis with higher timeframes that include H4 or Daily should be started and narrowed down with M15 or H1 to entry points.
Does price action succeed under any market condition?
It suits best in trending markets or well-defined ranges. Consolidation on the side should be exercised.
What should be the amount of risk per trade?
Novices must take risks of 1-2 percent of the account per trade to cater to the losses.
Conclusion
5 Easy Price Action Chart Analysis Tips for Forex Beginners is a clear and well-organized guide to trading. Learning the market structure, the most important patterns of candlesticks, the support and resistance areas, the confirmation of trends, and the ability to manage risks enable newcomers to make statements and analyze graphical representations. Begin with the observation of the charts and the identification of the key areas in a demo account. Monitor the
reaction of the price to the patterns, then invest real capital. Price action analysis can prove to be a solid foundation for profitable forex trading with patience, discipline, and constant practice.


One Comment