Best Guide to Reading Stock Charts and Graphs.
How to read stock charts and graphs in an easy way, in simple terms, with examples and tips for beginner chart analysis.
Reading Stock Chart and Graphs Step by Step
One of the most valuable skills that one who is interested in investing or trading has to be taught is how to read stock charts and graphs step by step. When novices observe the movements of the price lines, candles, and indicators upward and downward, they may be confused. It is a guide to stock charts, the reasons why stock charts are important, and how to interpret stock charts and graphs in a step-by-step manner using easy language and using examples.
What is a Stock chart and a stock graph?
Stock charts and graphs graphically display the movement of the price of a stock. They depict price variation, trading volume, and trends in the form of lines, bars or candlesticks. Investors do not need to guess the direction of the market, but rather use charts to help them understand the past and even determine the opportunities worth seizing. Charts simplify the complex market data and present it to beginners as easy-to-read information that can help make smarter decisions.
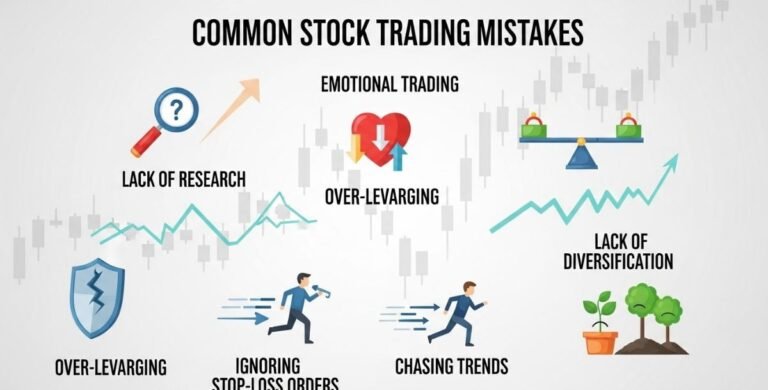
The reason Beginners find it difficult to read Stock Charts
The majority of the beginners are confused by technical terminologies, symbols, and rapidly changing prices. Charts can be confusing to the eyes, particularly when the indicators and patterns are both present. The main areas of concern are a lack of knowledge on where to begin, misinterpretation of the trends, and the use of hearsay rather than facts. Charts are not easy to use without a step-by-step approach, which makes them a bit confusing to use.
The Solution of these Problems by Stock Charts
Stock charts make the market behavior simple when used properly. They assist the investors in determining the trends, the support and resistance areas, and entry and exit points and times more efficiently. Knowing how to determine stock charts and graphs step by step will cultivate confidence and will diminish emotional decision-making.
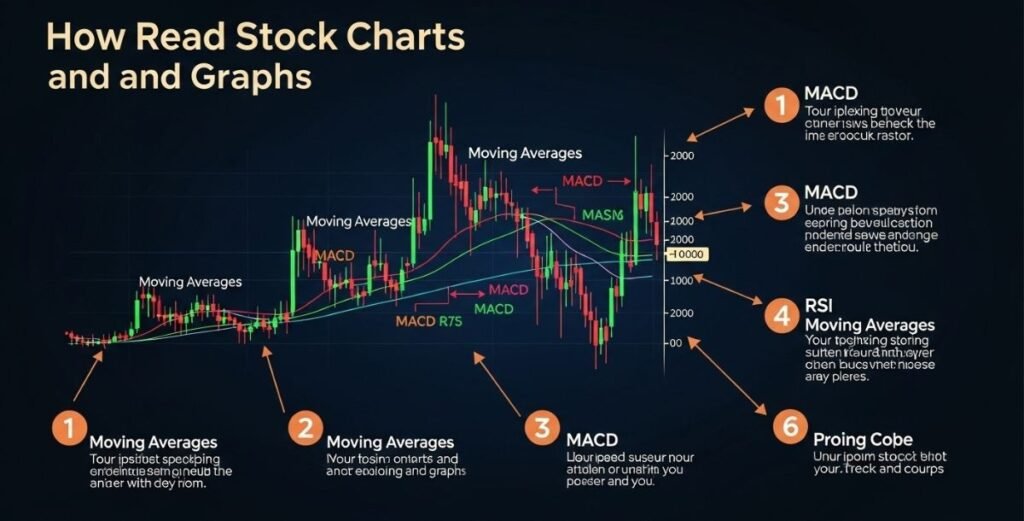
How to Read Stock Charts and Graphs Step-by-Step Guide
Step 1: Select an Appropriate Time Frame
Begin with a time frame, which is relevant to your objective. Daily, weekly, and monthly charts are used by long-term investors. Intraday charts are favoured by short-term traders. The period shifts the appearance of the price movement, and therefore, it is always important to match it with your strategy.
Step 2: Learn About the Price Axis and Time Axis
It is represented by the vertical axis of price and the horizontal axis of time. All the movements on the chart are the changes in the price during a particular period. It is important to learn this fundamental structure before proceeding to further analysis.
Step 3: Learn the Main Chart. The types of charts
Line charts display the closing prices, and these charts are simple for novices. Bar charts indicate the open, high, low, and close prices. Candlestick charts are the representation of the same data in a more graphical form. The candlestick charts are the most used as they indicate the situation in the market.
Step 4: Identify Trends
A trend indicates the overall direction of the price movement. An uptrend has an increased high and increased lows. A downtrend is characterized by low highs and low lows. Horizontal trends are a sign of consolidation. Identifying trends will assist the investors to trade in the market and not against the market.
Step 5: Know the Support and Resistance
Support is a level at which the interest in buying products prevents further deterioration of the price. Where selling pressure halts movement is the resistance. These levels can be used to determine entry areas, exit areas, and areas to place stop-loss.
Some of the important indicators applied in Stock Charts
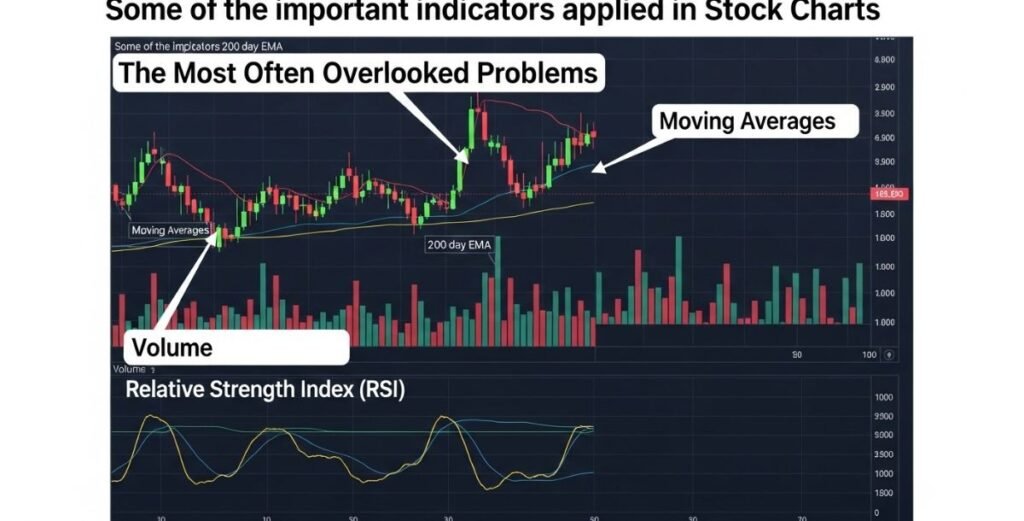
Moving Averages
Moving averages filter data and detect trends. Investors usually use the 50-day and the 200-day moving averages. The trend is usually a bullish trend when the price remains above a moving average.
Volume
Volume indicates the number of shares that are traded in a given time. Large volume will validate good movement of the price, and low volume will indicate poor movement. Volume gives the chart signals a background and provides confirmation.
Relative Strength Index (RSI)
RSI is used to determine overbought or oversold stock. A value that exceeds 70 is indicative of overbought, and a value less than 30 is indicative of oversold. This assists traders from getting into the positions at extreme levels.
The Most Often Overlooked Problems
Among the big errors made is taking too many indicators simultaneously. This creates misunderstandings and miscommunication. The other problem is the lack of attention to the general trend and the attention paid to the short-term price fluctuations. Novices are also known to respond emotionally to charts rather than use a systematic approach.
Best Practices when reading Stock Charts
Begin with some basic charts and add indicators as you go. The trend in the market is always to be analyzed, and then individual stocks are to be concentrated on. Reading charts frequently and seeing the trends of past prices to learn the trends. Accuracy is enhanced with time.
Aids in Chart Analysis: Tools and Platforms
Online trading platforms will provide interactive charts, drawing, and indicators. Charting software enables one to design layouts and test plans. Stock screeners can be used to filter stocks by price movement, volume, and technical indicators. These are tools that ensure that you can put into practice what you have learned.
The marked difference in using Stock Charts by Investors and Traders
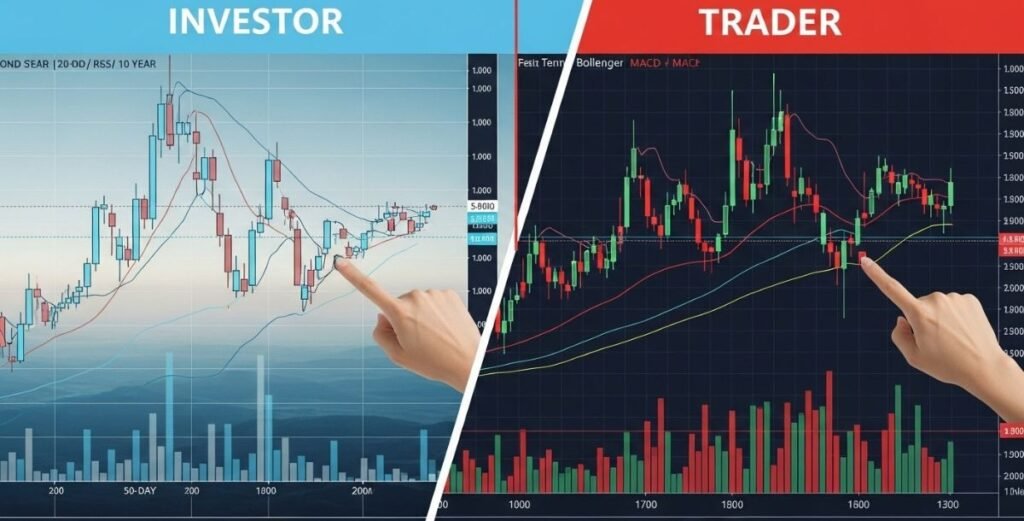
Charts are used by long-term investors to ensure that they do not purchase at the top. Short-term traders use charts to determine the exact time to enter and exit. The knowledge of your intention assists you in reading charts better and preventing undue complications.
Can Stock Charts be Relied On to make Decisions?
Stock charts are means, but not guarantees. They give probabilities on the basis of past data and not predictions. Charts can be effective decision-making tools when they are used together with risk management and basic research.
FAQs
Which Stock chart is easiest to use as a beginner?
The simplest ones are the line charts, which are easy to interpret; however, candlestick charts have more productive information when the fundamentals have been mastered.
Should I have pointers to stock charts?
No, the price action will not be able to give valuable insights alone. Indicators are voluntary instruments.
Are beginners able to use stock charts without experience in trading?
Yes, charts are easy to learn when they are done in steps.
What is the time frame for learning how to read charts?
Weeks are enough to develop basic knowledge, and practice is needed to become a master.
Are stock charts applicable in long-term investing?
Yes, they can be used to determine trends and prevent inappropriate timing decisions.
Conclusion
Education in stock chart and graph reading, always in stages, will eliminate confusion and instill confidence in investment decision-making. Knowing the types of charts, trends, level of support, and indicators, beginners are able to analyze stocks better. The third thing would be to read charts daily with the help of a demo or a charting platform and practice these skills on a regular basis.